Table of Contents
Final project: Spectrum analyzer
Description
A spectrum analyzer is useful for measuring the frequency content of a signal. If an oscilloscope plots v(t) versus t, a spectrum analyzer plots Sv(f) versus f where Sv(f) is the spectral density of v(t). In this project you'll build a simple spectrum analyzer. All the building blocks are familiar to you from previous experiments.
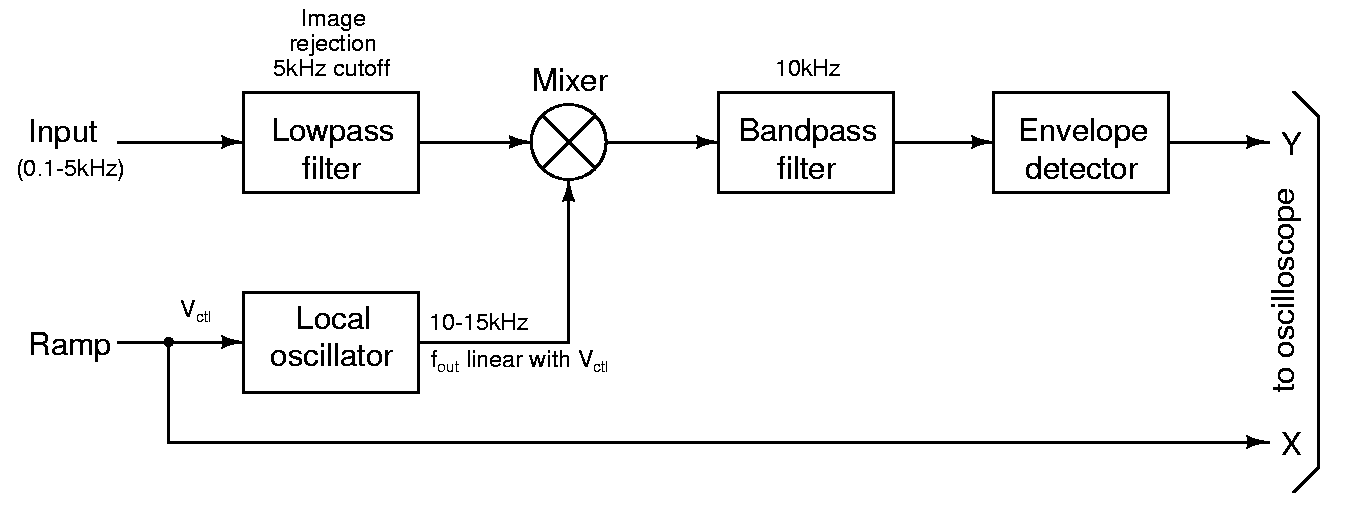
A basic realization of a spectrum analyzer is a very narrow bandpass filter that can be tuned to any frequency f0 followed by an signal strength(rms/envelope) detector. The output will be the strength of the input signal inside the passband of the bandpass filter. For very narrow bandwidths, there is very little variation in Sv(f) inside the filter's passband and what is measured (by a signal strength detector) corresponds to sqrt(Sv(f)*fb) where fb is the filter's bandwidth. It is very difficult to realize a tunable narrow bandpass filter and therefore, the signal is translated using a mixer driven by a variable frequency oscillator to a fixed frequency bandpass filter. In the system above, the input frequencies are in the range 0.5-5kHz(A lower limit of 0.5kHz enables ac coupling in the signal chain). These frequencies can be upconverted to 10kHz by mixing them with a local oscillator signal in the range 10.5-15kHz. A 10kHz filter is used to extract the signal component and a rectifier+filter is used to measure the signal strength.
Block diagram and specifications
The block diagram of the spectrum analyzer is shown in the above figure. Each block is described briefly below. For a more detailed description of the spectrum analyzer, see the references at the end of the page.
- Low pass filter: This is used to reject the image frequencies-20.5-25kHz which also result in a 10kHz signal when mixed with 10.5-15kHz local oscillator. Use a fourth order Chebyshev filter realized as a cascade of two single opamp second order sections. See below for single opamp filter topologies.
- Mixer: This is used to mix the input signal with the local oscillator. Use an MC1496 double balanced modulator with a differential to single ended converter for this.
- Local oscillator: Output frequency varies from 10.5-15kHz as a linear function of the control voltage Vctl.
- Bandpass filter: Isolates the signal in a narrow band around 10kHz. Use an active-RC filter with a quality factor of 20 for this purpose.
- Envelope detector: This is used to measure the signal strength
The control voltage Vctl to the VCO is a measure of the frequency at which the signal strength is measured and forms the X co-ordinate of the display. The output of the signal strength detector is the Y co-ordinate. By sweeping Vctl slowly, it is possible to measure the signal strength versus frequency. Plotting the envelope detector output versus Vctl on the oscilloscope in X-Y mode, one can get a display of the signal spectrum.
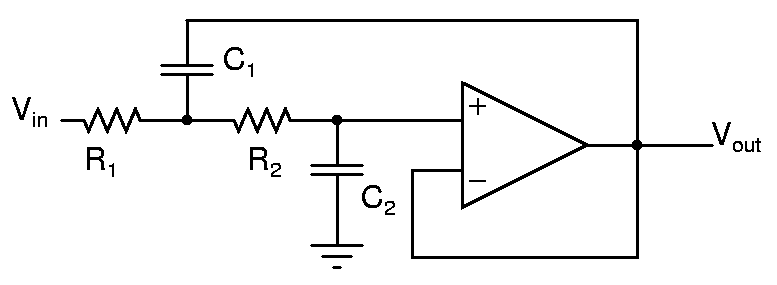
Sallen-Key filter
The topology of a Sallen-Key filter is shown above. A fourth order Chebyshev filter with a passband attenuation of 1dB can be made with a cascade of two second order sections with {fp=0.96f0, Q=3.56} and {fp=0.53f0, Q=0.78} where f0 is the desired passband edge(5kHz in this case). Use LF347 opamps.
Bandpass filter
Use the active RC filter with LF347 opamp you built in this experiment with Vi1,R as the input and V1 as the output. Design it for a quality factor of 20 and verify it. If you are unable to realize a Q of 20 in a single stage, use two stages in cascade each with a Q of 10.
Oscillator
You can use the oscillator you built in this experiment.
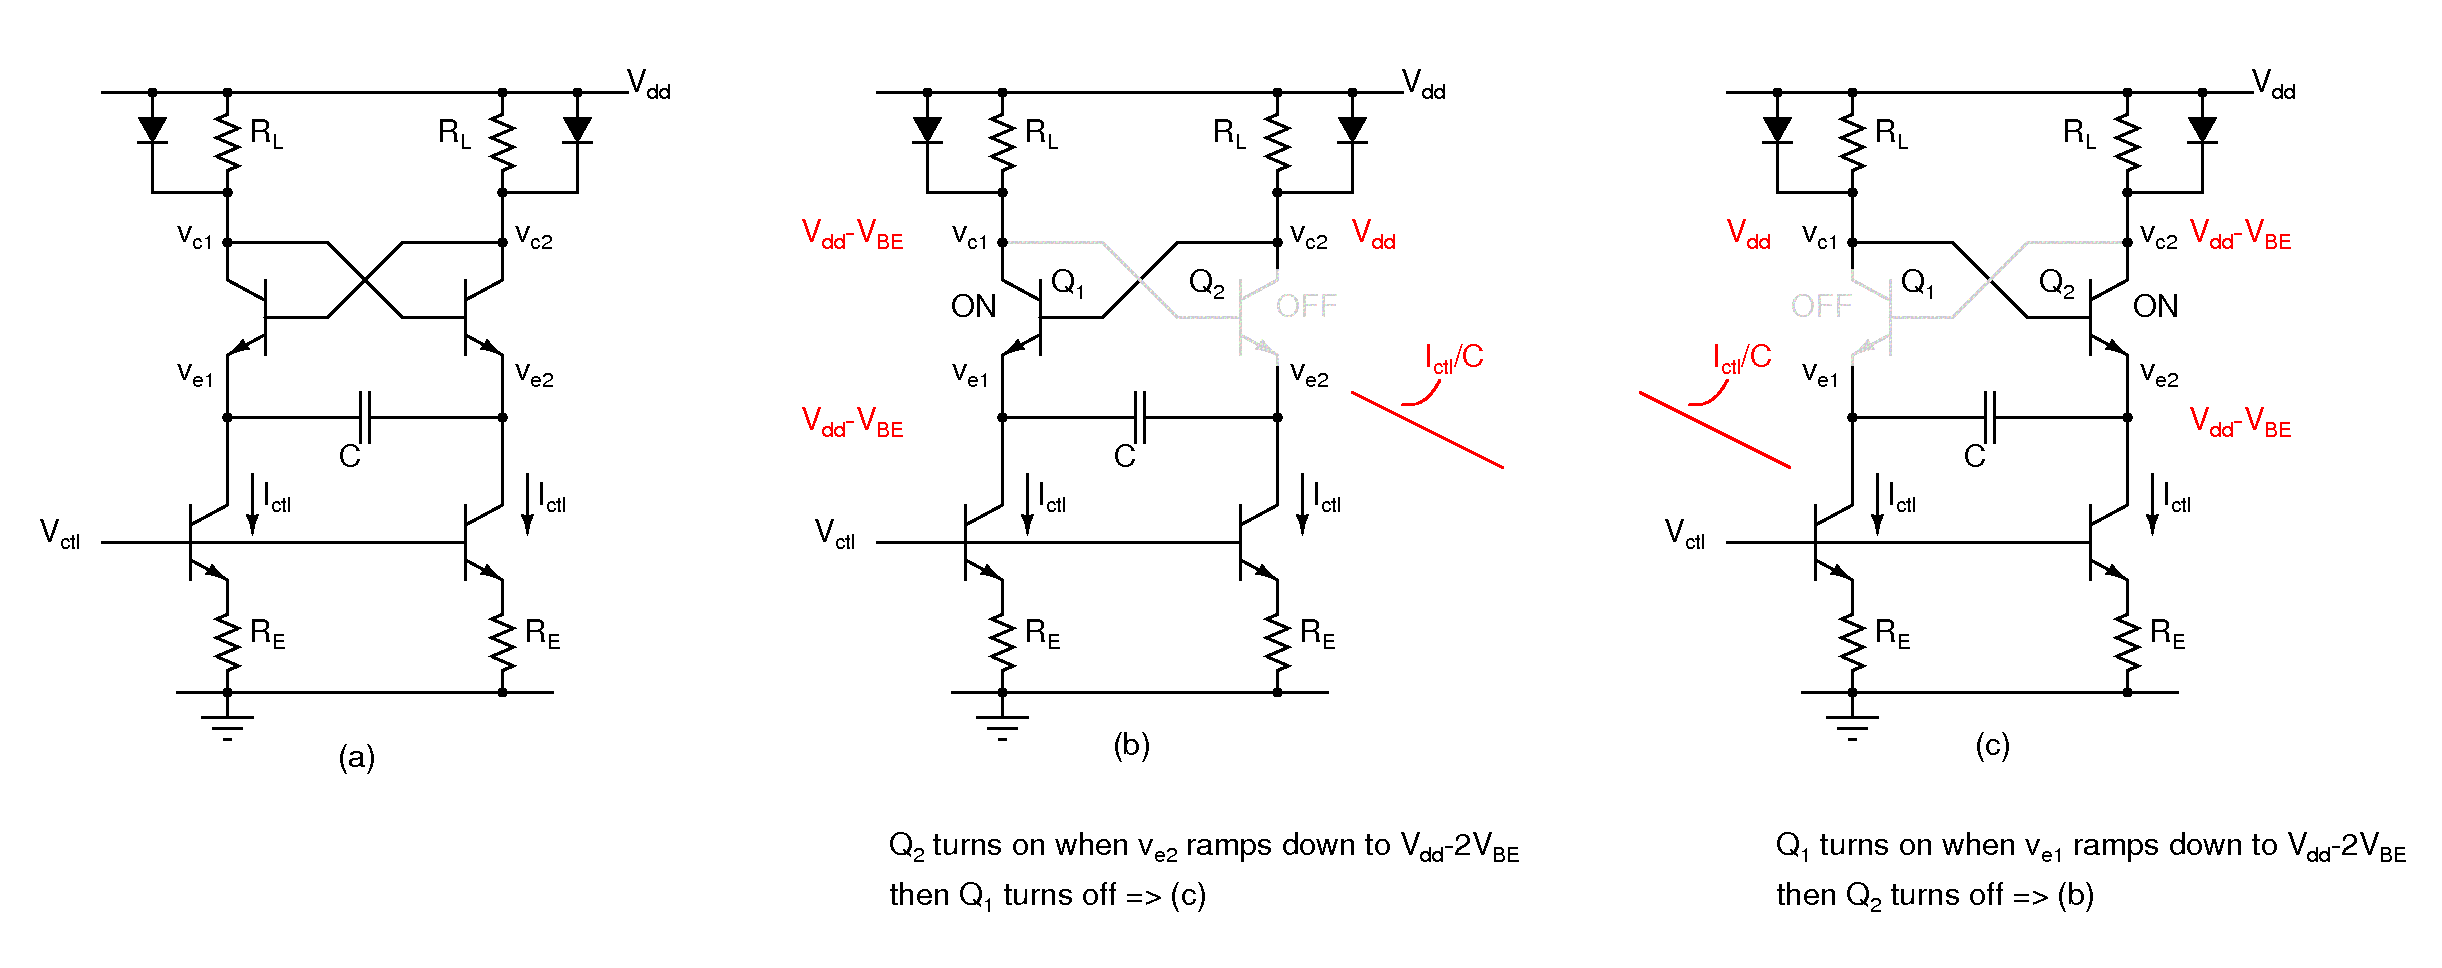
If you are bored of that topology, you can try the one below. The frequency of oscillation is given by Ictl/(4C*VBE). VBE ~ 0.65V. Fig. (a) shows the schematic and (b, c) show the two phases of oscillation. Choose Ictl*RL to be more than a diode drop(0.65V). Take the output from the collectors to obtain a square wave. The diodes in parallel with the collector load prevent the collector voltage from going too low. (Use 1N4148 diodes whenever available. 1N4001 series diodes have thick leads which can be a bit difficult to insert into the breadboard, and possibly expand the clips inside resulting in loose contacts later.)
Signal strength detector
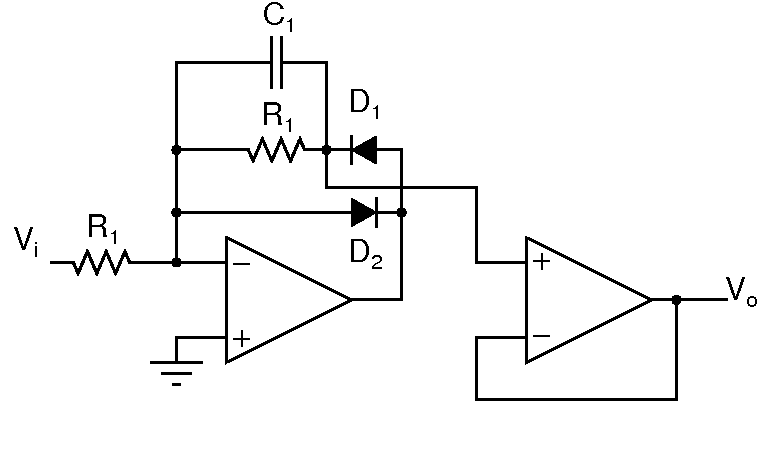
For the spectral density, one needs the rms value of the output signal of the bandpass filter. If the passband is sufficiently narrow, this signal is approximately a sinewave. For a sinewave, the rms can be measured directly using an rms detector or can be measured indirectly by using an envelope detector(and dividing the output by sqrt(2)) or using a rectifier+lowpass filter and (multiplying the output by π/sqrt(2)). With the components available to us, the simplest reliable strength detector is a half wave rectifier+lowpass filter shown below.
The output will be the average of the half wave rectified waveform, which is a measure of the input signal strength.
- Current flows through R1||C1 in negative half cycles of Vi
- Choose R1C1 to remove the lowest input frequency
- D2 maintains negative feedback around the opamp in positive half cycles of Vi
- Use an additional RC section for filtering if necessary.
How to go about building it
One of you can work on the envelope detector, bandpass filter, and the mixer and the other can work on the sweep oscillator and the image rejection lowpass filter. Start working backwards from the envelope detector and test each part before connecting it to the following stage. The sweep oscillator and the lowpass filter can be tested individually before connecting them to the mixer. The experiments were done with different supply voltages. For the project, minimize the number of supplies required by using a common supply voltage for all blocks to the extent possible.
References
- Spectrum analyzer basics Seminar slides from Agilent technologies
- Spectrum analysis basics Agilent technologies application note 150


